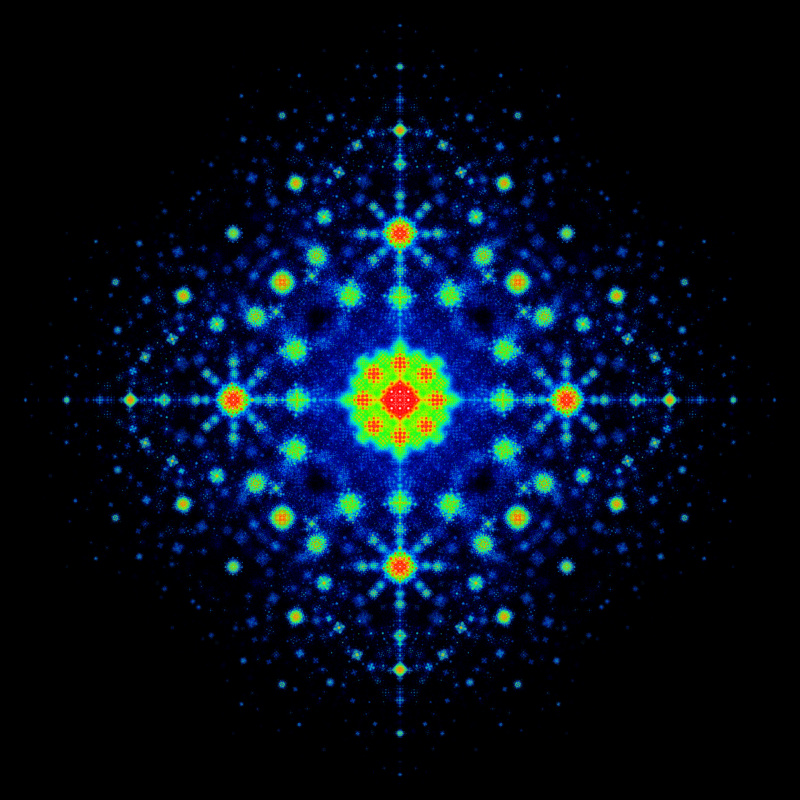
A density plot in the complex plane of the Bohemian eigenvalues of a sample of 10 million 10x10 tridiagonal matrices with entries sampled from the set {0, ±1, ±i, ±20, ±20i}. Color represents the eigenvalue density and the plot is viewed on [-48-48i, 48+48i].