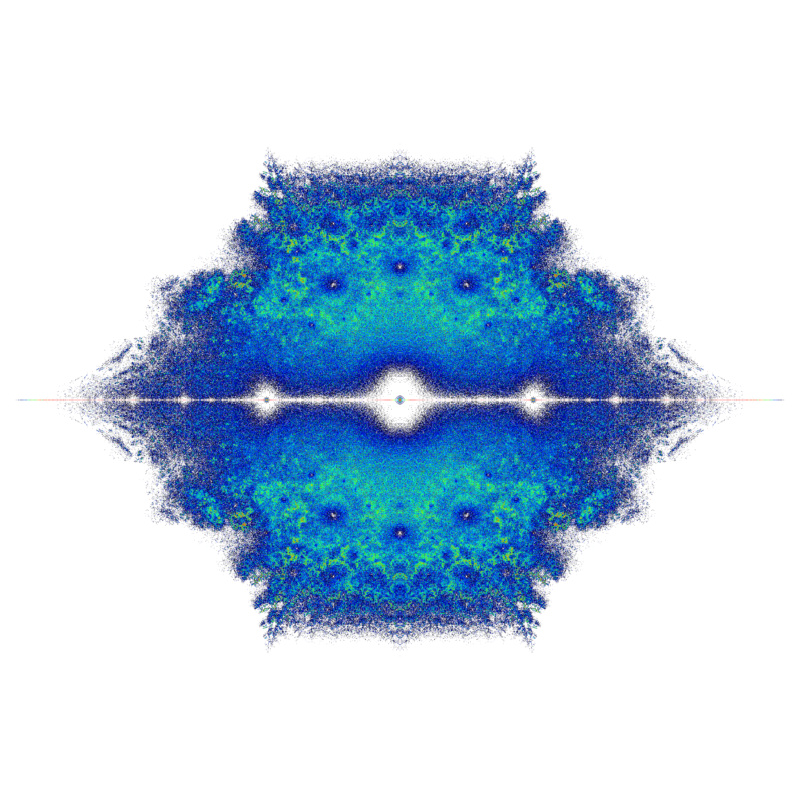
A density plot in the complex plane of the Bohemian eigenvalues of a sample of 100 million 15x15 tridiagonal matrices. The entries are sampled from {-1, 0, 1}. Color represents the eigenvalue density and the plot is viewed on [-3-3i, 3+3i]. Plot produced by Cara Adams.