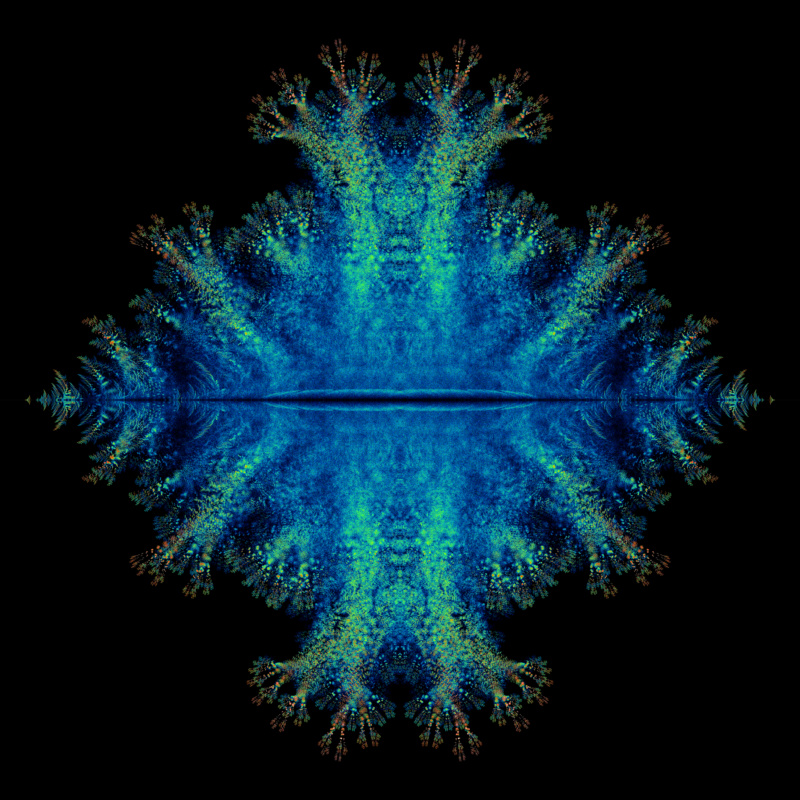
A density plot in the complex plane of the Bohemian eigenvalues of a sample of 1 million 100x100 upper Hessenberg matrices with a Toeplitz structure. The entries are sampled from the population {-1, 1}, entries on the main diagonal are fixed at 0, and entries on the subdiagonal are fixed at 1. Color represents the eigenvalue density and the plot is viewed on [-3-3i, 3+3i].