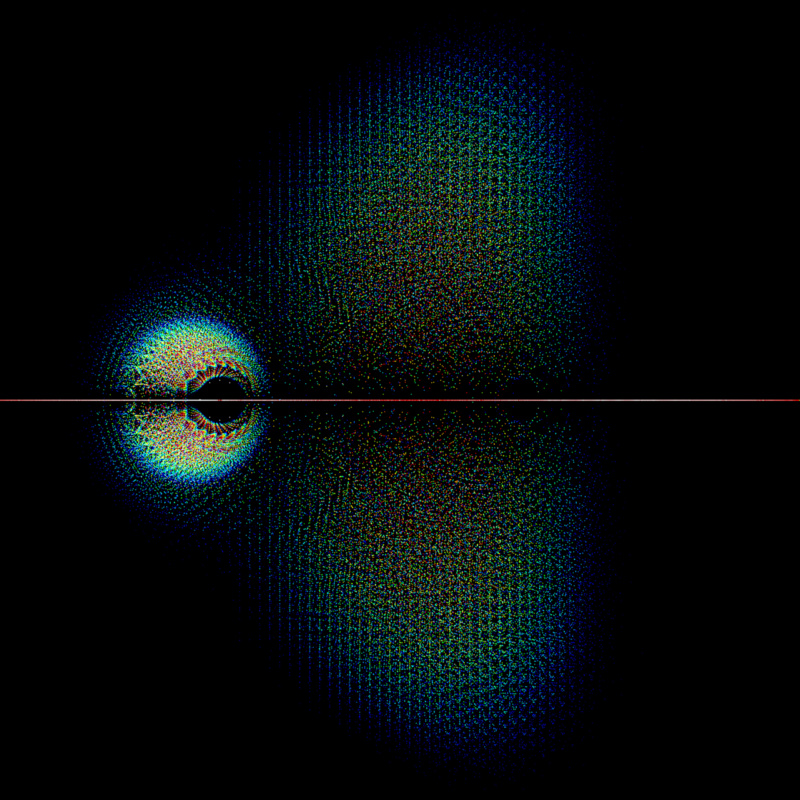
A density plot in the complex plane of the Bohemian eigenvalues of a sample of 50 million 60x60 Vandermonde matrices with entries sampled from {-1, 0, 1}. Color represents the eigenvalue density. Viewed on [-10-30i, 30+20i]. Plot produced by Tiam Koukpari.